MONITORING
Coastal estuaries in Southern California are highly complex systems that can be difficult to understand because they are subjected to numerous natural and anthropogenic drivers that affect their processes (e.g. hydrology), generate impacts, determine how habitats evolve over time, and affect populations of sensitive species. While some of these drivers are constant in nature, others vary in magnitude over temporal scales. Furthermore, coastal estuaries like the Los Peñasquitos Lagoon are often shaped by episodic events that can occur during shifts in climate that are possible during the El Niño – Southern Oscillation (ENSO). Establishing an effective monitoring program is a critical to understanding these systems and guide adaptive management required for these urbanized coastal estuaries.
Understanding the importance of collecting quality data, the Los Peñasquitos Lagoon Foundation (LPLF) helped to establish the longest-running continuous monitoring program within the Southern California Region through the 1985 Lagoon Enhancement Plan. Designed by the Pacific Estuarine Research Lab (PERL) with guidance from Joy Zedler (PERL director), the monitoring program was implemented in 1987 and has run continuously since then.
The monitoring program is guided by a set of objectives and action items designed to better inform management efforts within Los Peñasquitos Lagoon and its watershed in order to achieve the goal of restoring and protecting the Lagoon as well as to help document regional shifts in habitat type and distribution in Southern California coastal estuaries.
Monitoring Objectives:
- Assess the health and ecological value of the Lagoon and its systems.
- Document changes in the functional values of the lagoon system, especially in terms of the habitat value for birds and fish.
- Help determine the timing of implementation for elements of Lagoon Enhancement Plan
- Evaluate the success of the various elements of the Lagoon Enhancement Plan.
Action Items:
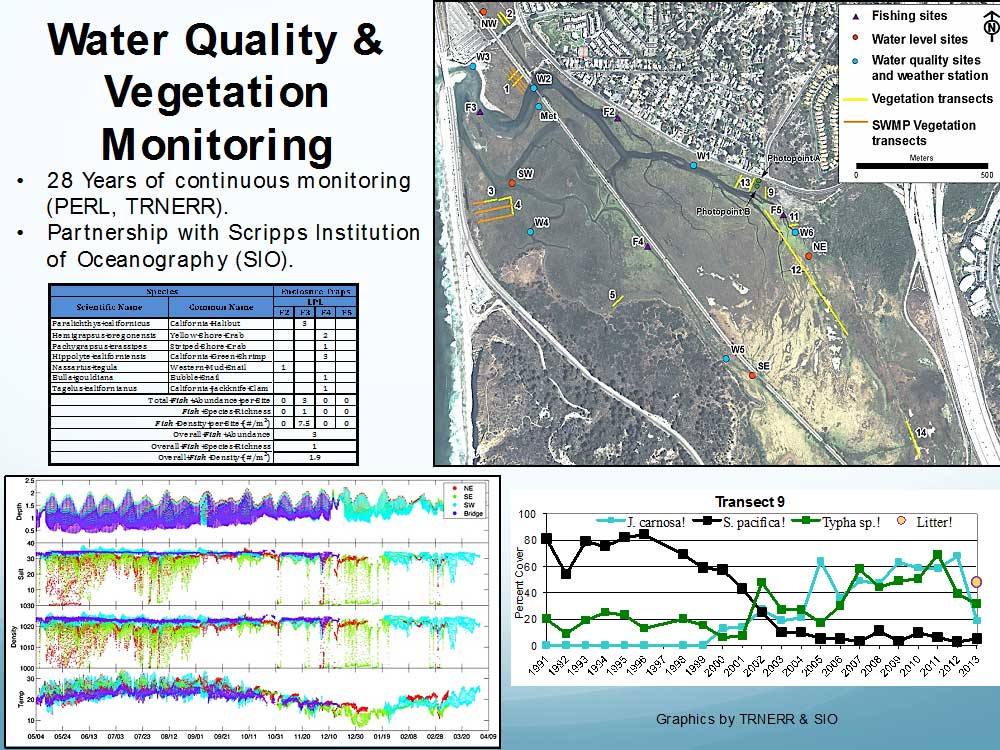
- Periodically measure the physical and chemical parameters of the lagoon waters, such as water level, salinity, temperature, conductivity, and dissolved oxygen.
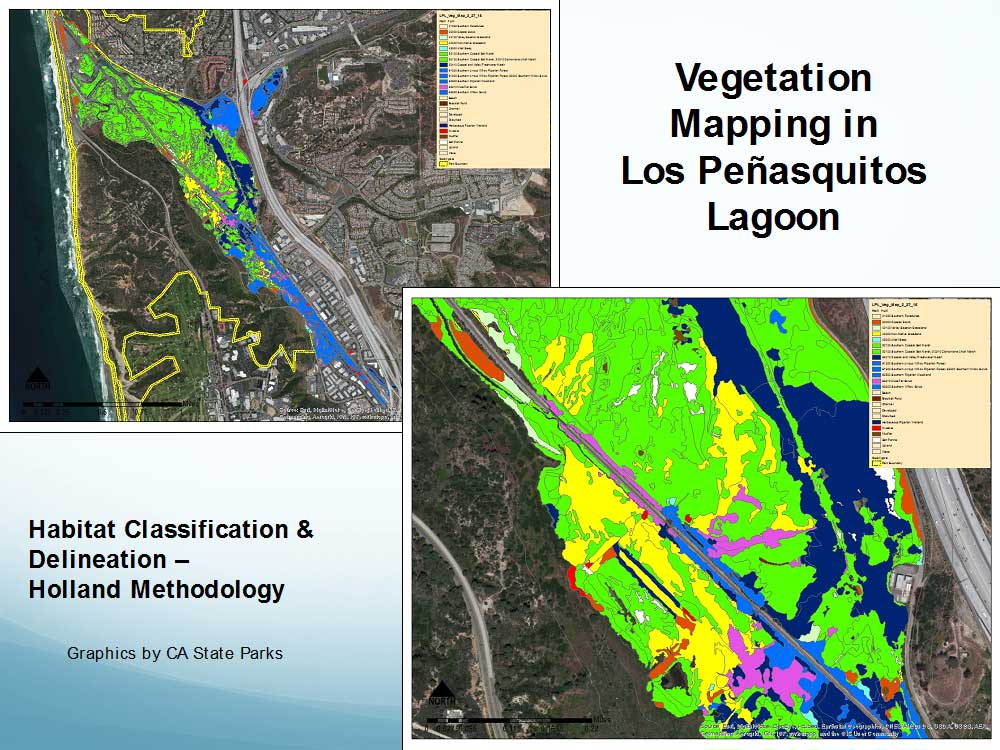
- Measure the biological parameters that includes surveys of benthic invertebrates, fish, birds, and vegetation.
- Measure the amount of runoff and sedimentation originating from the major lagoon tributaries, and relate this information to the amount of rainfall.
- Observe and document each enhancement activity, record the duration and location of each lagoon mouth opening and the conditions under which it closes, and periodically measure channel depths.
In 2014 the monitoring program was expanded with funding provided by the County of San Diego’s Vector Habitat Remediation Program. While the original program focused more on managing the lagoon inlet, it was determined that water quality monitoring should be expanded to other areas of Los Peñasquitos Lagoon to better understand how watershed inputs of freshwater affect tidal circulation within lagoon channels and habitat changes in the eastern portion of the lagoon where historic salt marsh has been displaced by brackish and freshwater habitats. Three new permanent monitoring stations were installed within lagoon channels to compliment water quality monitoring performed at Monitoring Station W2, located at the railway bridge near the inlet (See Figure). Using YSI model EXO-2 multi-parameter data loggers, the new stations will improve spatial characterization of water quality parameters in channel segments within LPL that are fully tidal versus areas with limited to no tidal influence. A description of the original and the newly established monitoring stations is provided in the next section.


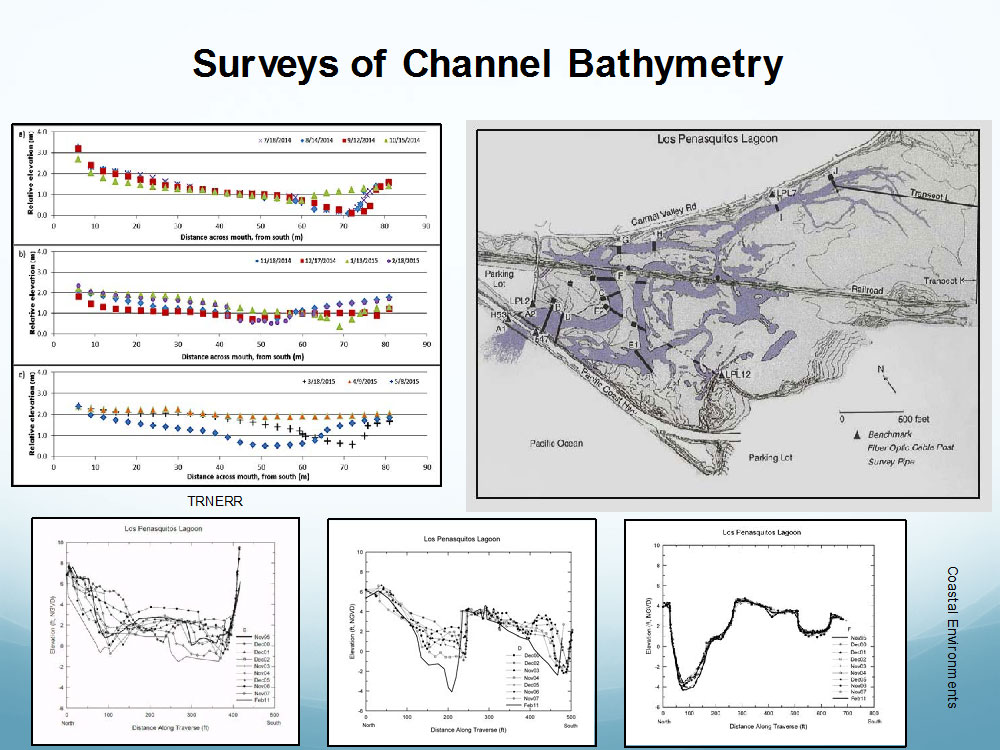
LPLF also monitors elevations and channel dimensions (depth, width) within Los Peñasquitos Lagoon to have a better understanding of habitat distribution, channel morphology (how it changes over time) and channel dimensions that can influence tidal circulation. The figure below provides the established survey transects within Los Peñasquitos Lagoon that have been monitored since 1995. Results from these surveys are shown below, demonstrating the dynamic nature of channel morphology near the inlet area (Transect B and Transect D) and the relatively stable nature of channel morphology further away from the inlet. Grain size analysis is also performed to help characterize sediments in the inlet area of Los Peñasquitos Lagoon and determine their origin.


